School Performance Data
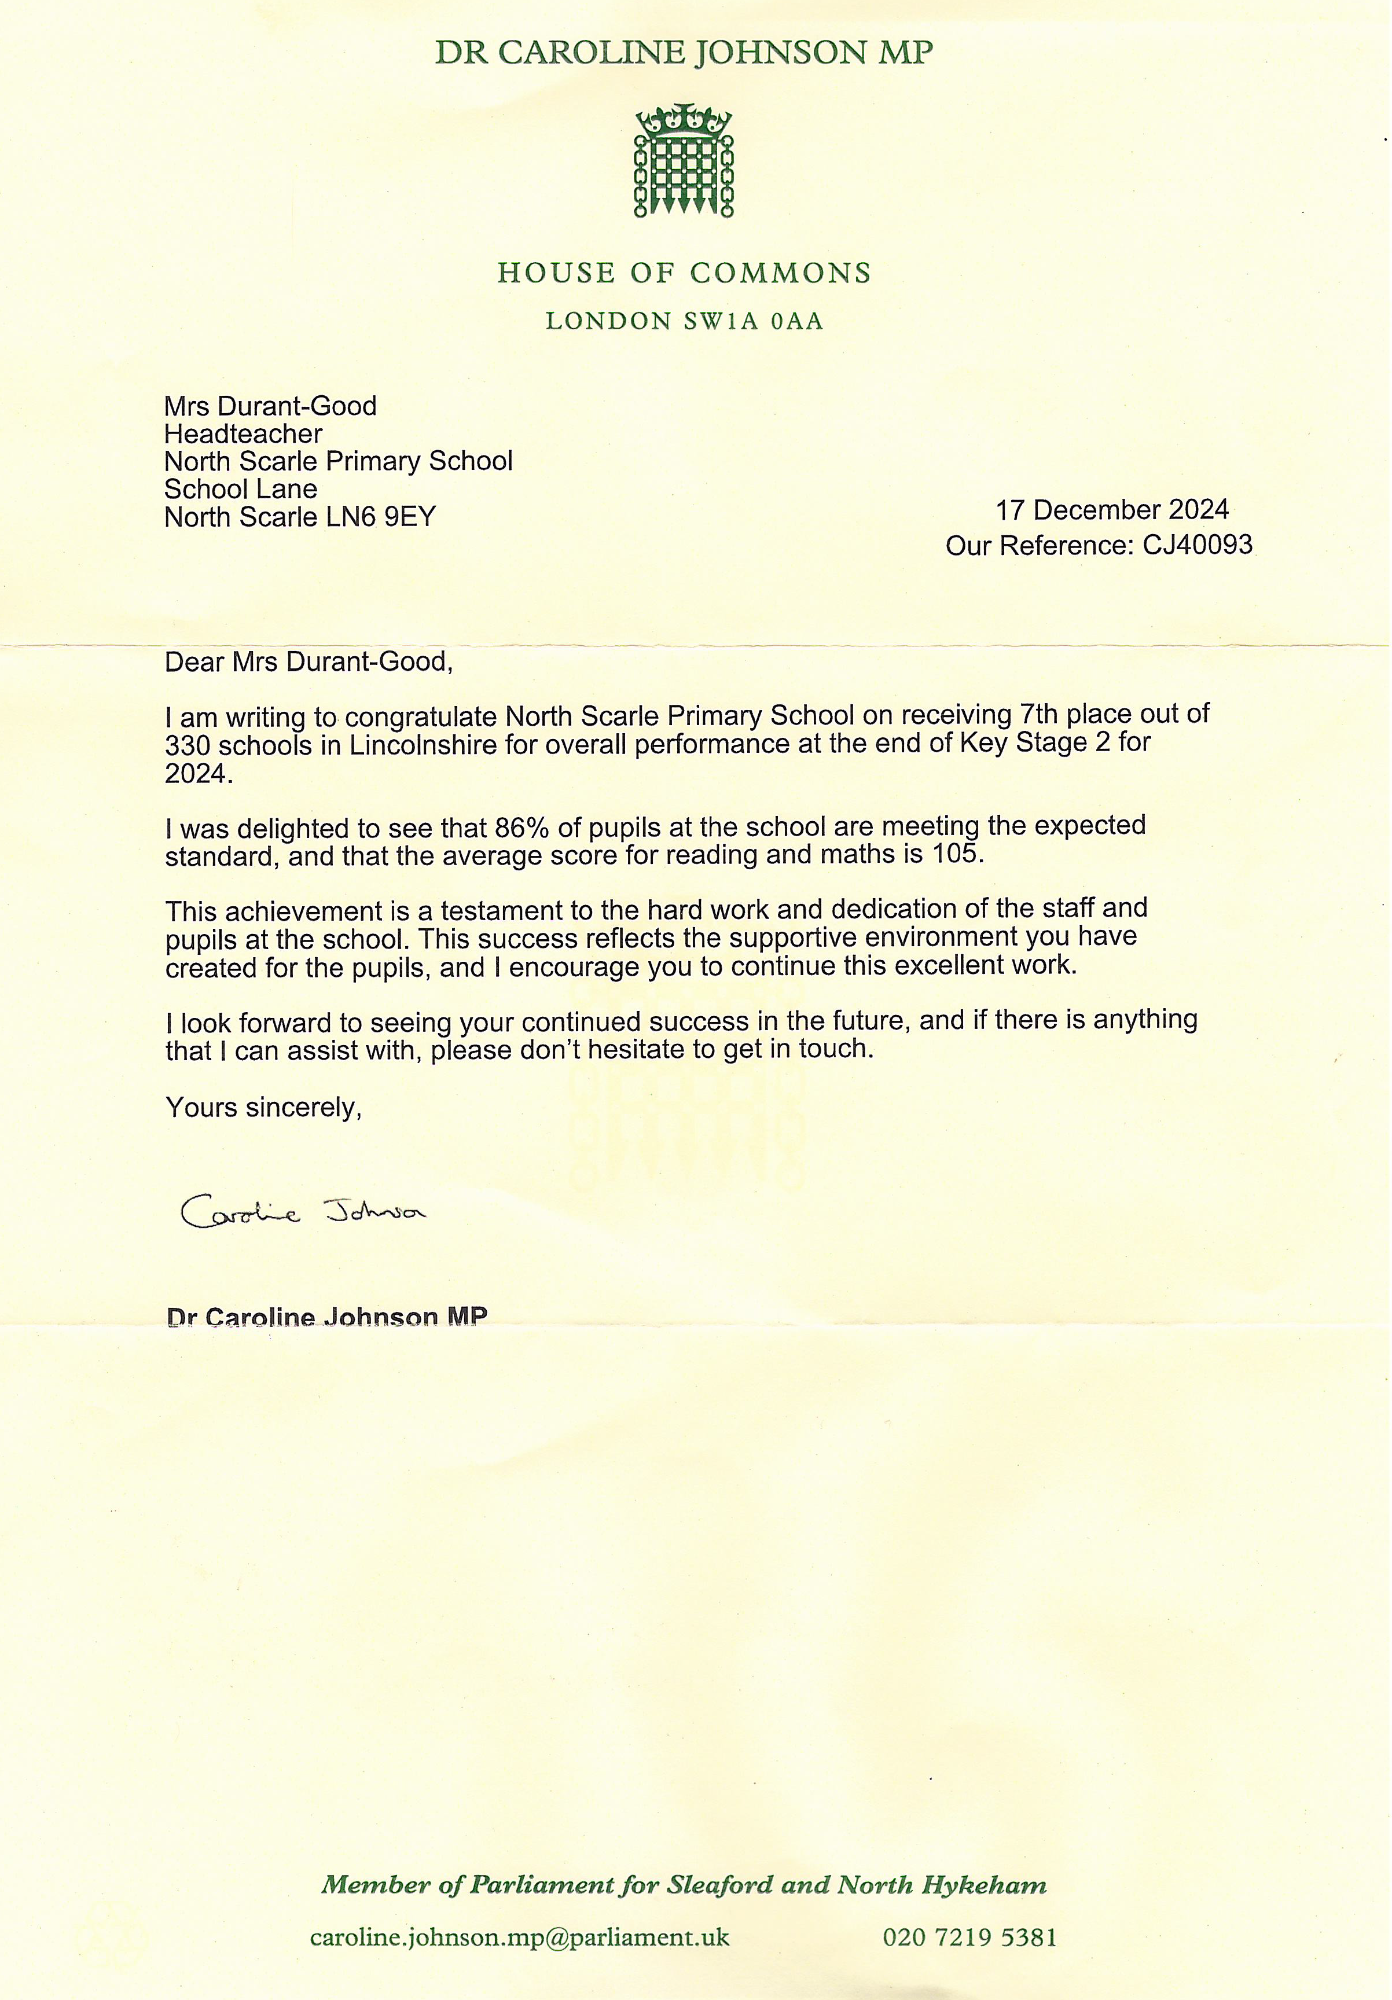
North Scarle Primary School is ranked 7th out of 330 Lincolnshire Primary Schools
for overall performance at the end of Key Stage 2.

End of Key Stage 2
|
KS2 National Data |
2019 National % |
2019 North Scarle % |
2022 National % |
2022 North Scarle % |
2023 National % |
2023 North Scarle % |
2024 National % |
2024 North Scarle % |
||||
|
EXS |
GD |
|
EXS |
GD |
|
EXS |
GD |
|
EXS |
GD |
||
|
Reading |
73 |
40 |
20 |
74 |
83 |
17 |
73 |
82 |
9 |
74 |
100 |
- |
|
Writing |
78 |
60 |
20 |
69 |
83 |
17 |
71 |
64 |
45 |
72 |
100 |
14 |
|
Maths |
79 |
70 |
20 |
71 |
67 |
- |
73 |
91 |
0 |
73 |
86 |
- |
|
SPAG |
78 |
80 |
30 |
72 |
83 |
17 |
72 |
64 |
18 |
72 |
100 |
43 |
|
Combined RWM |
65 |
40 |
10 |
59 |
50 |
- |
60 |
64 |
- |
61 |
86 |
- |
|
No. of pupils (% per pupil) |
|
10 (10%) |
|
6 (16.6%) |
|
11 (9%) |
|
7 (14.2%) |
||||
North Scarle Primary School is ranked 7 out of 330 Lincolnshire Primary Schools for overall performance at the end of Key Stage 2.
We do not have any data to publish for the academic years 19/20 and 20/21 due to the Covid - 19 pandemic and the cancellation of all tests and exams by the Government.
Please click the links below to see our current school performance data and the school performance tables website.
